The Mass Balance Model Saga Continues
Introduction
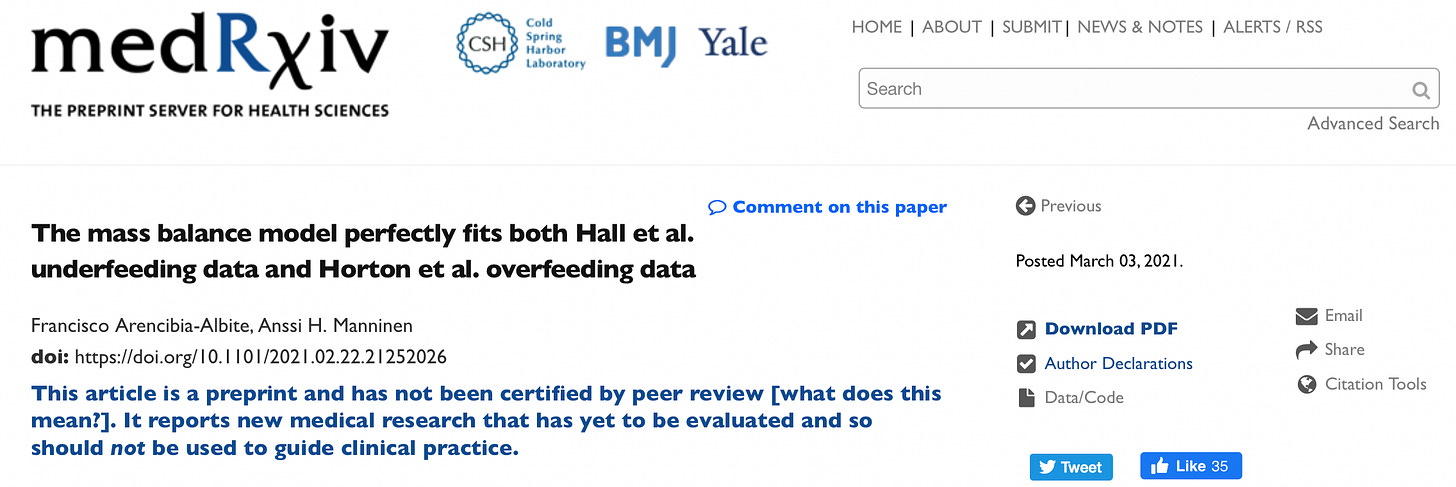
In the most recent installment of the Mass Balance Model Saga, Arencibia-Albite and Manninen respond to my most recent critique by modeling the very studies that I provided in support of my contention that the Mass Balance Model (MBM) has very little utility over the well-established Energy Balance equation for describing changes in body fat. (To be fair, their model also addresses changes in body weight, but honestly, who cares about body weight in itself? People want to lose fat, fat causes the health problems, it all comes down to body fat.) They now contend that their model perfectly fits the (well-controlled) studies that I provided, thus apparently strengthening the position of the MBM and leaving me with proverbial egg on my face.
Let us see how their new publication apparently shows how the MBM is still superior to energy balance for explaining changes in body fat.
Modeling of the Hall et al. study
First, the authors model Kevin Hall’s study, which I argue falsifies the predictions of the MBM given that the high-fat diet (with lower mass) used in the trial did not result in greater DEXA-estimated fat mass loss than the reduced fat (i.e. higher mass) diet despite the diets being isocaloric. (Remember: the MBM states that a lower mass diet should win out.) In their model they replicate the same results of Hall et al. (which only lasted 6 days) and then extend that model for a total of 180 (hypothetical) days. It is here they believe their model offers more explanatory power.
What does the extended model show?
To be honest, I’m not 100% sure. If we look at the Figure (below) we can see that Panels A1, A2, and B1 all show the red dots/lines as the Reduced Fat (RF) groups (i.e. high carbohydrate, higher mass) and the black dots/lines as the Reduced Carbohydrate (RC) group (i.e. high fat, lower mass). For some reason Panel B2 has these colors/groups flipped. I am not sure how to interpret this. But let me try. If it’s a typo (which makes the most sense), Panel B2 actually shows a trivial -0.23 kg advantage of the Reduced Fat (higher mass) diet after 180 days of dieting—so much for the MBM predictions. If it’s not a typo and truly a switching of the colors/groups (which I would encourage them to update because it’s confusing) then the panel shows a trivial advantage for the Reduced Carbohydrate diet.
Regardless of which way it goes, a 0.23 kg difference in fat loss after 6 months is so unbelievably trivial that I’m not sure what benefit this model has over the energy balance equation? Certainly not a paradigm shifting result that should cause us to rethink what we currently know about calories, energy balance and fat loss. Even the authors state that the losses are “very similar”.
Perhaps most importantly, as I stated in my previous critique, this all assumes we could actually measure body fat this accurately with the available methodologies. Even the highly regarded DEXA (which Hall and company used) can be off by some 8-10% in individuals and off by 5% with changes over time. A difference this small (0.23 kg) between the groups is just plain meaningless if it truly were to manifest in a trial of this duration.
Modeling of Horton et al.
Arencibia-Albite and Manninen then proceed to model the Horton et al. overfeeding study (see Figure below), again claiming that MBM fits this data perfectly. Again, they model the same results as observed in the Horton trial (which I and Alan Aragon argued falsified the MBM given the similar increases in weight and fat). They then extend their model to a total of 365 days. (Why 365 instead of 180 days like before? I’m not quite sure.) Leaving aside the absurdity of someone actually being able to follow such a diet for a year straight, after 365 days the higher fat (i.e. lower mass) diet would lead to 0.51 kg greater fat gain than the lower fat (i.e. higher mass) group among the lean subjects (see Panel A4). (Again, quite trivial given the time period modeled, but certainly flies in the face of MBM predictions.) For the obese subjects, however, the higher carbohydrate, lower fat group is modeled to gain 1.09 kg more fat mass than the higher fat, lower carbohydrate group (see Panel B4).
Put simply, the model does not predict changes in fat mass based on the premises of the MBM—i.e. that a lower mass diet will lead to lower fat mass gain—in the lean subjects. Quite the contrary, it shows that the lower mass diet will lead to greater fat gain. For the obese subject data, however, the model does predict a changes in fat mass, as per the MBM. So mass matters in the latter but not the former. Got it.
Conclusions
In the end, I am failing to see how any of this offers anything useful over energy balance and what we already understand about changes in fat mass with diet. Given the limitations in the body composition methodologies that are feeding into the models’ assumptions and the paltry differences that actually manifest as a product of the model (and often in contradiction to what the MBM actually says it will predict!) some serious empirical data will need to come out showing any utility of this model. An no, not the crummy, poorly controlled free-living diet trials (that I covered in my first critique), but seriously controlled feeding studies that pan out to significant differences in fat loss/gain as per the MBM. So far, I’m just not seeing it.


